Understanding My Simple Stock Trading Setups
This article outlines two basic trading setups I use, explains how to use them, and offers tips for effective implementation. Remember, trading involves risk, and these setups are not guarantees of profit. Always practice on a demo account before risking real money.
Part 1: My Trading Setups
I use two main setups, each combining technical indicators to identify potential buy and sell signals.

Setup 1: Moving Averages and Momentum (Used 90% of the time)
This setup uses moving averages to identify trends and momentum indicators to gauge the strength of those trends.

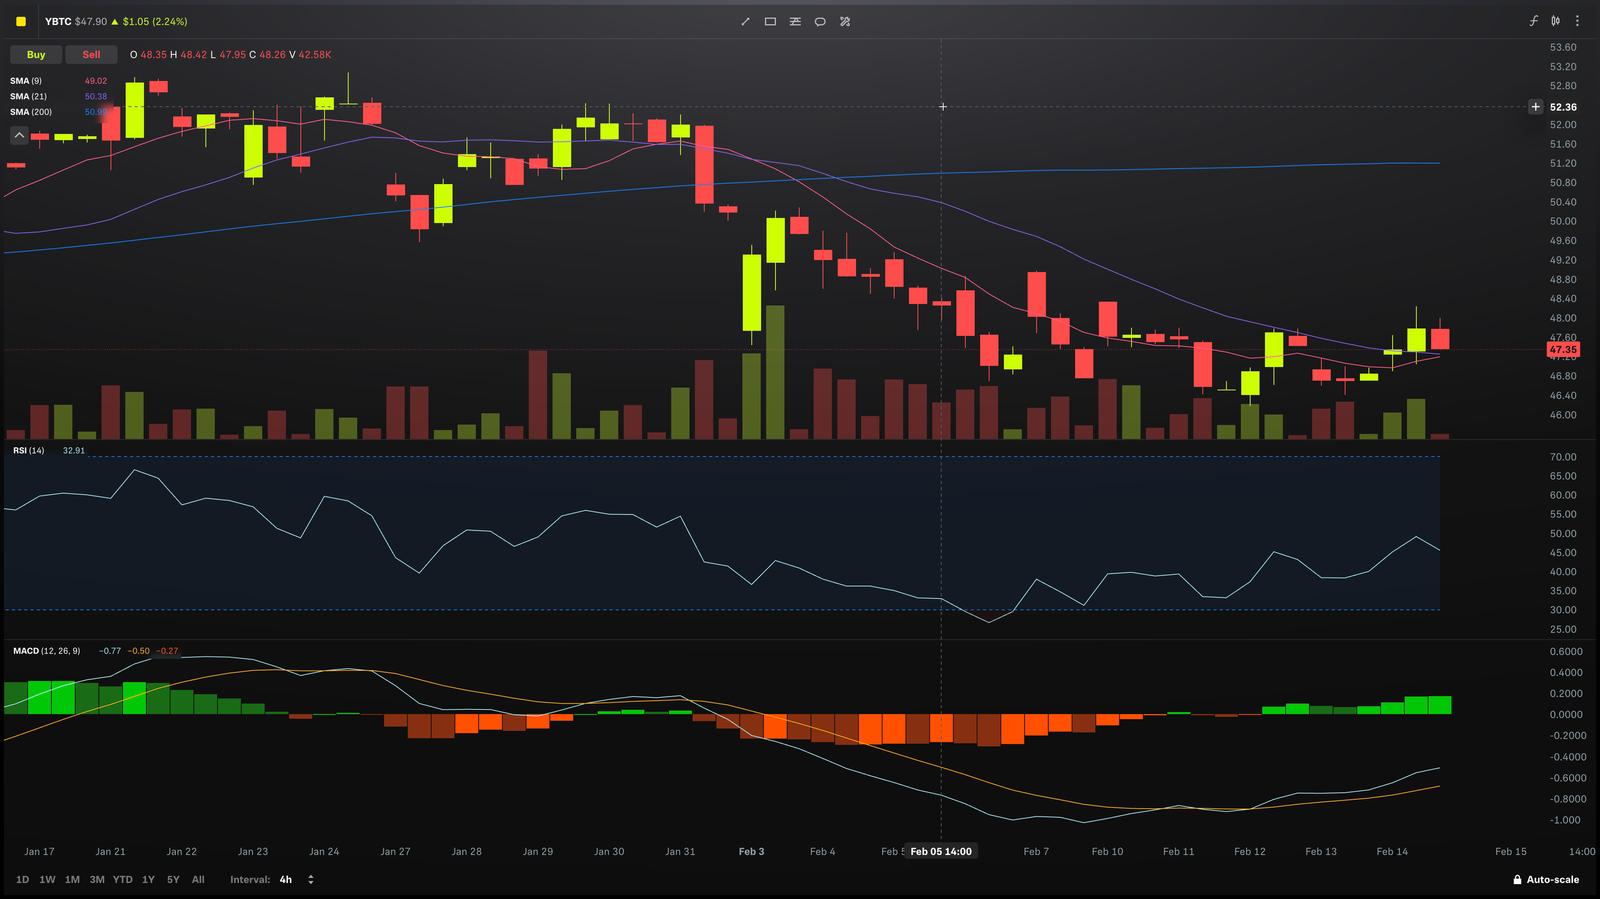
- Candlestick Charts: I use candlestick charts because they show more price detail than a simple line chart. Each candle represents a specific period (e.g., a day) and shows the opening, closing, and high and low prices.

- MACD (12, 26, 9): The Moving Average Convergence Divergence (MACD) is a momentum indicator that helps identify trend changes. The numbers (12, 26, 9) refer to the periods used in the calculation. A “buy” signal is generated when the MACD line crosses above the signal line, and a “sell” signal is generated when the MACD line crosses below the signal line.

- RSI (14): The Relative Strength Index measures the speed and change of price movements. It ranges from 0 to 100. An RSI above 70 is often considered “overbought” (price may be due for a fall), while an RSI below 30 is considered “oversold” (price may be due for a rise).
- Simple Moving Averages (SMA): A moving average smooths out price data by calculating the average price over a specific period. I use three SMAs:
- SMA 9: A short-term moving average.
- SMA 21: A medium-term moving average.
- SMA 200: A long-term moving average.
- Golden Cross: When the SMA 9 crosses above the SMA 21, it’s a bullish signal.
- Death Cross: When the SMA 9 crosses below the SMA 21, it’s a bearish signal.

Setup 2: Volume and Volatility (Used 10% of the time)
This setup uses volume and volatility indicators to gauge market sentiment and potential price swings.
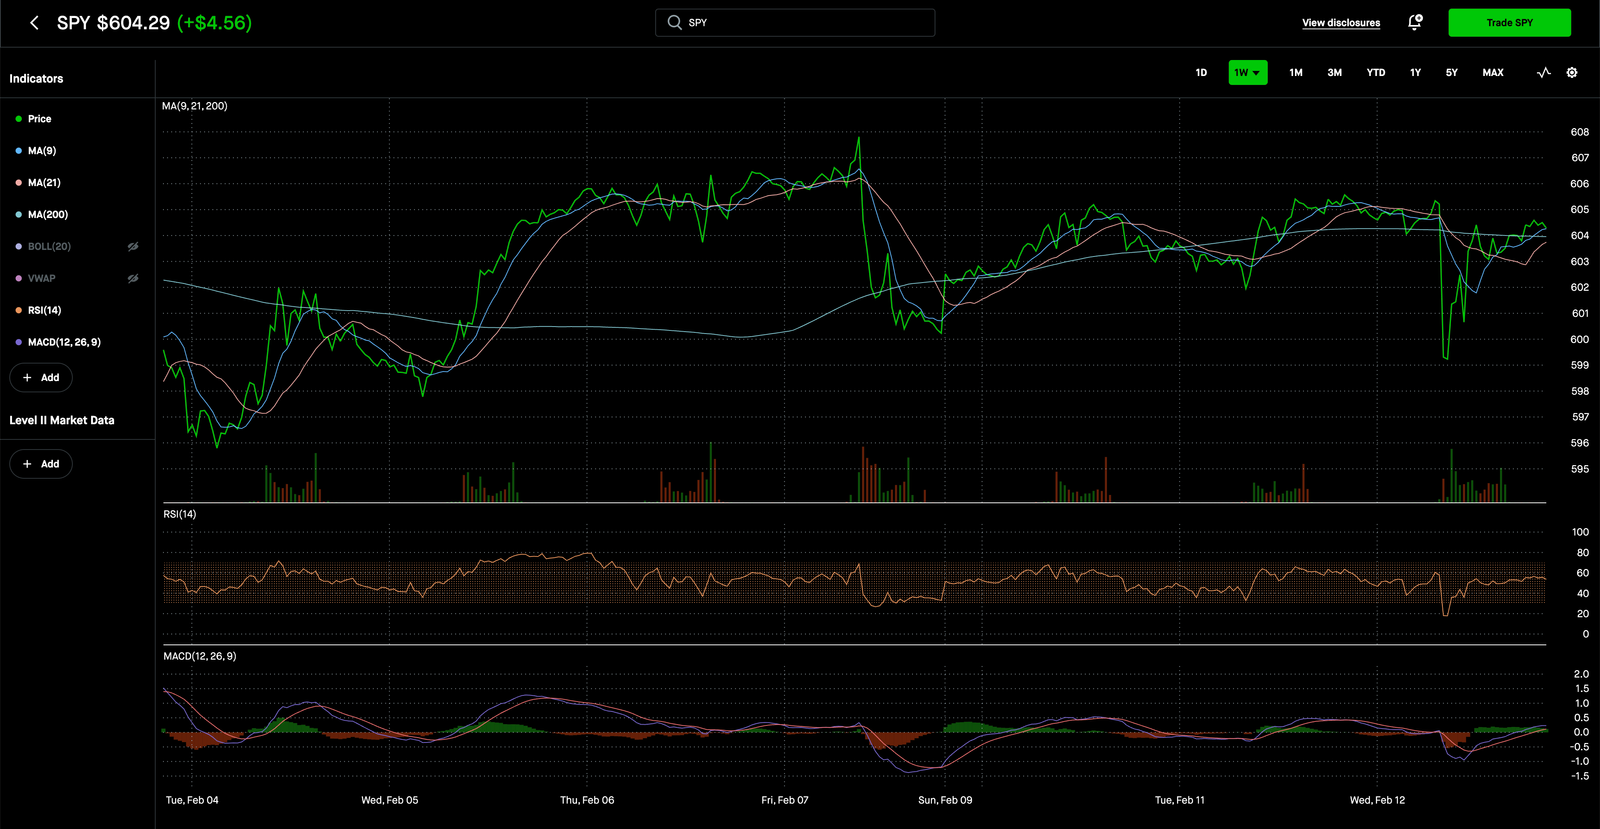
- MACD and RSI: Same as Setup 1.

- VWAP: The Volume-Weighted Average Price is the average price a stock has traded at throughout the day, weighted by volume. Day traders often use it.

- Bollinger Bands (20, ±2 standard deviations, exponential): These bands plot two standard deviations above and below a 20-period moving average. They show how much the price typically fluctuates. When the price touches the upper band, it might be overbought; when it touches the lower band, it might be oversold.
Part 2: How to Use the Setups

Setup 1: Moving Averages and Momentum
- Look for a golden cross (SMA 9 crossing above SMA 21) or a Death Cross (SMA 9 crossing below SMA 21). These help determine the current trend.
- Check the MACD for buy (MACD line crossing above the signal line) or sell (MACD line crossing below the signal line) signals. This confirms the potential trend change.
- Confirm with the RSI – is it overbought (above 70) or oversold (below 30)? This helps assess the strength of the trend.
- Consider the SMA 200. Is the overall long-term trend up (price above SMA 200) or down (price below SMA 200)? This gives a broader market perspective.

Setup 2: Volume and Volatility
- Check the MACD and RSI for buy or sell signals.
- Compare the current price to the VWAP. Is it above or below? This helps determine if the current price is higher or lower than the average price.
- Is the price near the upper or lower Bollinger Band? This helps identify potential overbought or oversold conditions based on volatility.
Part 3: Additional Tips for Effective Use
These tips apply to both setups unless otherwise noted:
- Start Simple: Don’t try to use all the indicators at once. Focus on understanding key ones, like MACD and RSI, and then gradually add others.
- Practice: Use a demo account to practice trading with these setups before using real money. This allows you to get comfortable with the indicators without risking your capital.
- Combine Indicators: Don’t rely on just one indicator. Look for confirmation from multiple indicators. For example, a buy signal from MACD is stronger if the RSI is also oversold.
- Manage Risk: Always use stop-loss orders to limit your potential losses. Never risk more than you can afford to lose.
- Be Patient: Don’t chase trades. Wait for the right opportunities to come to you based on your setup criteria.
- Learn Continuously: The stock market changes constantly. Keep learning and adapting your strategies to different market conditions.
- Journal: Record your trades, including entry and exit points, reasoning, and outcome. This will help you identify patterns and improve your trading.
- Consider Multiple Timeframes: Look at charts on different timeframes (e.g., daily, weekly) to get a broader view of the market. A signal on a longer timeframe is generally more reliable.
- No Guarantees: Remember that no trading strategy can guarantee profits. Be prepared for losses, and don’t let emotions drive your decisions.
Disclaimer:
Trading involves risk, and these setups do not guarantee profit. Past performance is not indicative of future results. This information is for educational purposes only and should not be considered financial advice. Always practice on a demo account before risking real money. Consult with a qualified financial advisor before making any investment decisions.