Understanding RSI and Its Significance in Stock Trading
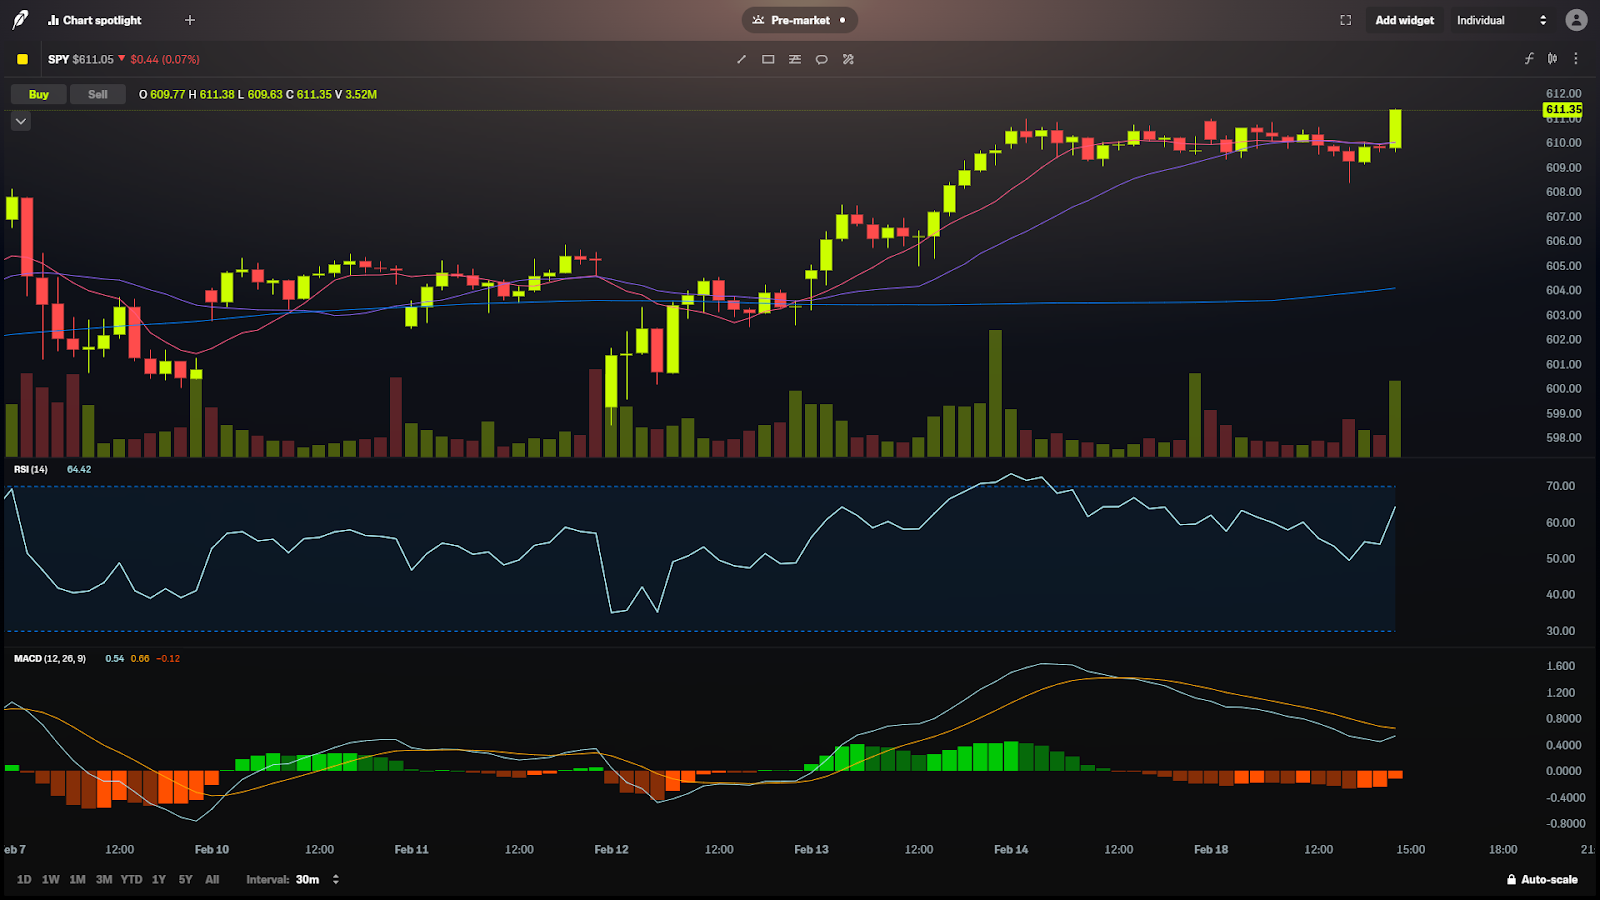
The Relative Strength Index (RSI) is a widely used momentum oscillator in technical analysis. It helps traders gauge the strength of price movements and identify potential overbought or oversold conditions in an asset. This guide provides a comprehensive overview of the RSI, specifically focusing on the most popular setting, RSI 14.
What is the Relative Strength Index (RSI) and How Does it Work?
Developed by J. Welles Wilder Jr. in 1978, the RSI is a technical indicator that measures the magnitude of recent price changes to assess an asset’s price momentum. It displays a value between 0 and 100, calculated based on the average gains compared to average losses over a chosen period, typically 14.
Here’s how to interpret the RSI values:
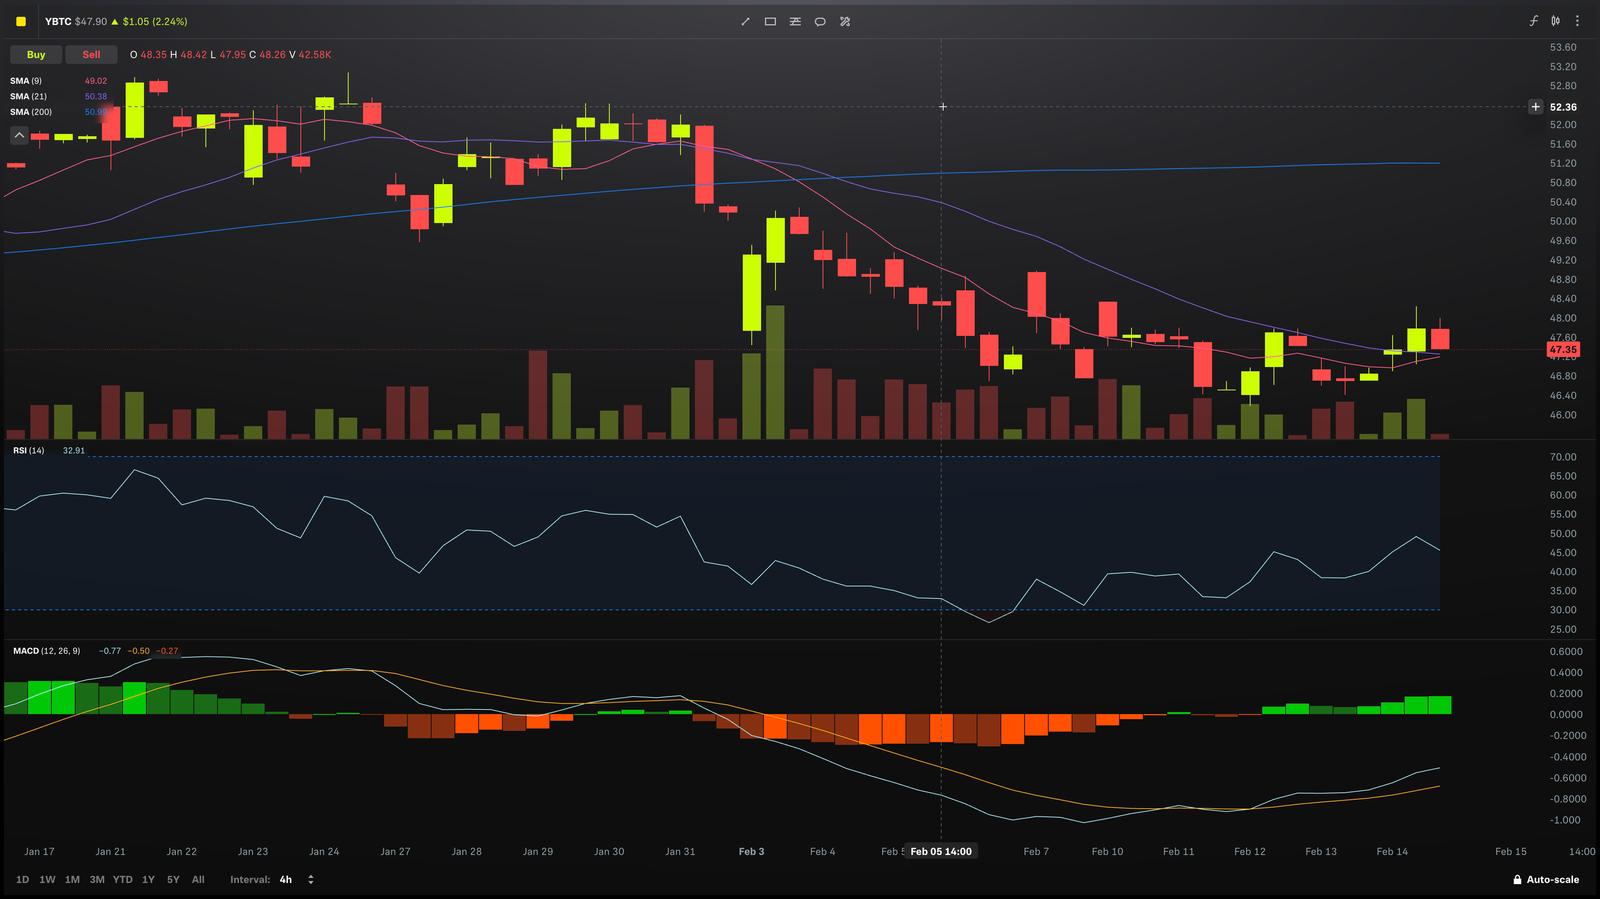
- 0-30: Indicates that an asset may be oversold (potential buying opportunity).
- 70-100: Suggests that an asset may be overbought (potential selling opportunity).
The RSI is valuable because it helps traders make informed decisions about entering or exiting trades based on the underlying momentum.
Why is RSI 14 Important for Traders?
The standard RSI setting is 14 periods. This timeframe balances responsiveness to price changes with signal reliability.
- Shorter periods (e.g., RSI 9): More sensitive to price movements but prone to generating false signals.
- Longer periods (e.g., RSI 21): Smoother lines but may react slower to price changes.
RSI 14 offers a versatile and balanced approach, making it ideal for most traders.
How to Calculate the Relative Strength Index (RSI): A Step-by-Step Guide
The RSI calculation involves several steps. Here’s a breakdown of the accurate RSI formula and its application:
- Calculate Average Gain and Average Loss
Calculate Average Gain (AG) and Average Loss (AL) over the chosen period (e.g., 14 days):
- Identify all price gains (positive price movements) and losses (negative price movements) within the chosen period.
- Calculate the average gain (AG) by summing the gains and dividing by the number of periods (e.g., 14).
- Calculate the average loss (AL) in absolute terms (ignore negative signs) by summing the losses and dividing by the number of periods (e.g., 14).
Compute the Relative Strength (RS):
RS = AG / AL
Calculate the RSI:
- RSI = 100 – (100 / (1 + RS))
Example:
If the average gain over 14 days is 2 points and the average loss (in absolute terms) is 1 point, then:
- RS = 2 / 1 = 2
- RSI = 100 – (100 / (1 + 2)) = 66.67
An RSI value of 66.67 suggests upward momentum but not necessarily an overbought condition.
How to Interpret RSI Signals in the Stock Market
The RSI offers versatility and can be used in various ways to identify trading opportunities:Overbought and Oversold Levels:
- RSI above 70: Indicates a potentially overbought asset, suggesting a possible price pullback or correction.
- RSI below 30: Indicates a potentially oversold asset, suggesting a possible price rebound.
Divergences
- Bullish Divergence: When the price makes a lower low but the RSI forms a higher low, it can signal a potential trend reversal upwards.
- Bearish Divergence: When the price makes a higher high but the RSI forms a lower high, it can signal a potential trend reversal downwards.
Trend Confirmation
In strong trends, RSI levels often stay in specific ranges:
- Uptrend: RSI levels often stay between 40 and 80, supporting the upward trend.
- Downtrend: RSI levels often stay between 20 and 60, supporting the downward trend.
Failure Swings
A failure swing occurs when the RSI breaks above 70 (or below 30) and then reverses direction. This pattern can confirm potential trend reversals.
Trading with RSI: How to Use RSI in Your Trading Strategy
Here are some practical strategies to incorporate RSI into your trading:
Combine with Support and Resistance
- If RSI is below 30 and the price is near a strong support level, it may signal a potential buying opportunity.
- Similarly, if RSI is above 70 and the price is near a resistance level, it may signal a potential selling opportunity.
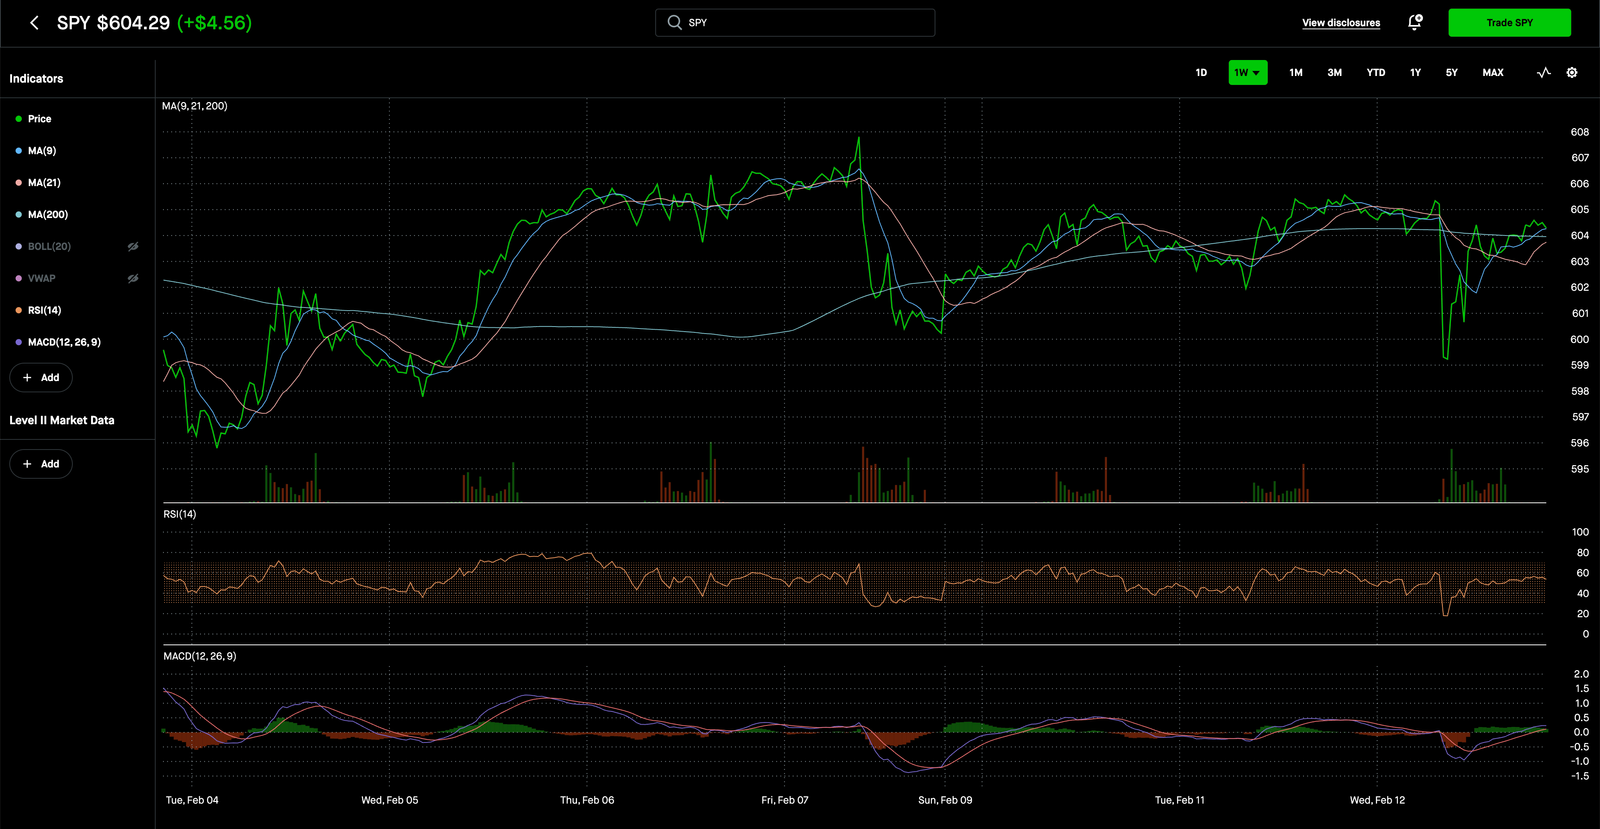
Pair with Moving Averages
Use RSI with moving averages to confirm trends.
For Example:
If the RSI shows oversold conditions while the price is above a 200-day moving average, it could indicate a high-probability buy signal.
Time Entries and Exits
- Utilize RSI to time your trade entries in trending markets.
- Consider exiting trades when the RSI signals overbought or oversold conditions.
Advantages of the Relative Strength Index (RSI)
- Ease of Use: The RSI is relatively simple to understand and apply, even for new investors.
- Versatility: It can be applied across various timeframes (daily, hourly, etc.) and markets (stocks, forex, cryptocurrencies).
- Trend Confirmation: RSI helps confirm the strength of existing price trends.
- Versatility: It can be adjusted to suit different trading styles and risk tolerances.
Limitations of the Relative Strength Index (RSI)
- False Signals in Trending Markets: In strong trending markets, the RSI can remain overbought or oversold for extended periods, generating false signals.
- Lagging Indicator: As the RSI relies on historical price data, it may not always accurately predict future price movements.
- Best Used in Combination: While effective, RSI is often more reliable when used in conjunction with other technical indicators and fundamental analysis.
Adjusting the RSI for Your Needs: Optimizing RSI Settings for Traders
The default 14-period RSI is a starting point. You can adjust the period to suit your trading style:
- Short-Term Trading: Consider using shorter periods like RSI 7 or 9 for quicker signals in fast-moving markets.
- Long-Term Investing: Consider using longer periods like RSI 21 or 30 for smoother signals that filter out short-term noise.
Conclusion: Key Considerations When Using RSI
The RSI 14 is a valuable tool for traders of all levels. By understanding its calculations, interpretations, and limitations, you can effectively incorporate it into your trading strategies. Remember that no single indicator guarantees success. Always use the RSI in conjunction with other technical analysis tools, sound risk management techniques, and a thorough understanding of market conditions.
For further learning and resources on trading strategies, visit https://freethetrade.com/
Disclaimer: This article is for informational purposes only and does not constitute financial advice. Trading involves significant risk, and past performance is not indicative of future results. Always conduct thorough research and consult a qualified financial advisor before making investment decisions.